


Getting the Perfect Exposure: Using Histograms as a Guide

Getting the perfect exposure is a crucial aspect of photography, as it determines how light or dark your image appears. Histograms are powerful tools that can help photographers achieve the desired exposure by providing a visual representation of the tonal distribution in an image. Understanding histograms and using them as a guide can significantly improve your photography skills. Here’s a breakdown of how histograms work and how to use them effectively:
What is a Histogram? A histogram is a graph that represents the distribution of tones in an image, ranging from shadows (blacks) on the left to highlights (whites) on the right, with mid-tones in between. The horizontal axis represents the tonal values, and the vertical axis represents the frequency of pixels at each tonal value. In simpler terms, the histogram shows how many pixels in your image have a particular brightness level.
Using Histograms for Exposure: Histograms are valuable tools for assessing exposure because they provide an objective and quantitative representation of the image’s tonal range. Here’s how you can use histograms as a guide to achieving the perfect exposure:
- Understand the Histogram Scale: The histogram’s horizontal axis ranges from 0 (pure black) to 255 (pure white) in an 8-bit image. If you’re shooting in RAW or a higher bit-depth format, the histogram will reflect a broader tonal range.
- Evaluate the Exposure: Take a test shot and review the histogram on your camera’s LCD or in post-processing software. If the histogram is pushed too far to the left, it indicates underexposure, while if it’s pushed too far to the right, it indicates overexposure.
- Examine the Peaks and Gaps: A well-exposed image should have a histogram that doesn’t spike against the left or right edges, indicating lost details in shadows or highlights, respectively. Instead, the histogram should have a smooth distribution across the tonal range, showing a good balance of shadows, mid-tones, and highlights.
- Adjust Exposure Settings: Depending on the histogram analysis, you can make exposure adjustments to improve the tonal distribution. For example:
- Underexposed: Increase exposure by using a slower shutter speed, wider aperture, or higher ISO.
- Overexposed: Decrease exposure by using a faster shutter speed, narrower aperture, or lower ISO.
- Histograms and Different Lighting Conditions: Be aware that certain scenes with high contrast or predominantly dark or bright areas might have histograms that appear skewed. In such cases, you may have to prioritize which areas of the image you want to expose correctly.
- Check the Highlights and Shadows: While histograms help evaluate overall exposure, they don’t show individual details in highlights and shadows. Use your camera’s highlight alert (blinkies) or a post-processing software to identify overexposed areas and adjust accordingly.
Histograms are Objective Guides: One of the key benefits of histograms is that they offer an objective assessment of exposure, allowing you to avoid relying solely on the camera’s LCD, which can be misleading, especially in varying lighting conditions. By using histograms as a guide, you can consistently achieve well-exposed images, providing a solid foundation for further creative adjustments in post-processing.
1. Histogram Types: There are different types of histograms you may encounter, depending on the camera or software you are using. The most common ones are luminance histograms (representing brightness values) and RGB histograms (representing the distribution of red, green, and blue channels). Luminance histograms are usually the ones you’ll find on most cameras and are the most important for exposure evaluation.
2. Understanding Histogram Shapes: Histograms can have various shapes, each indicating different tonal distributions in your image:
- Bell-shaped: This is a well-exposed image with a good balance of shadows, mid-tones, and highlights. The histogram forms a smooth, bell-shaped curve, without any extreme spikes on either end.
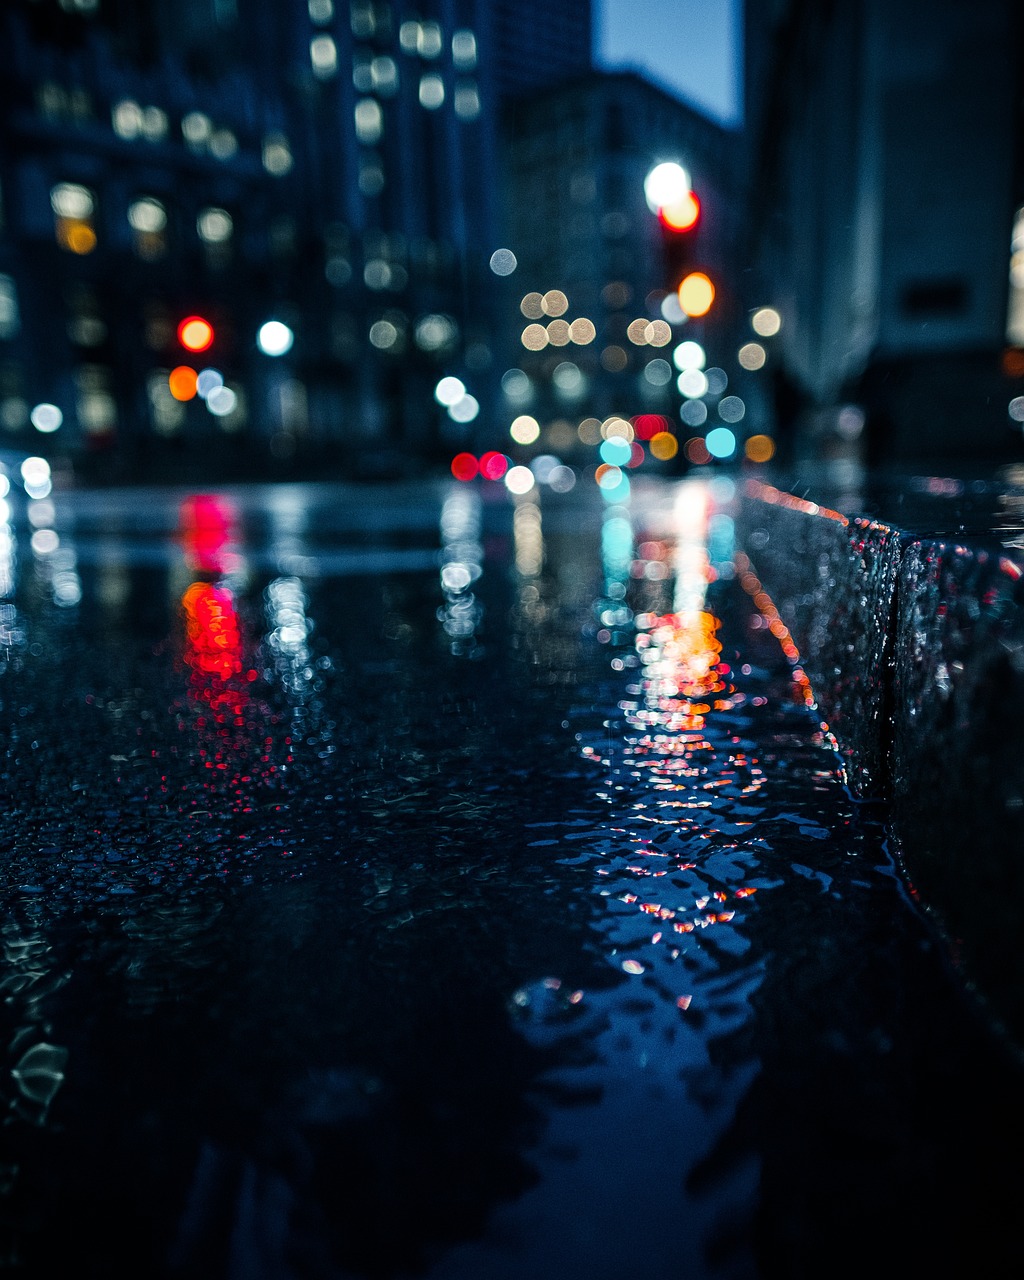
- Skewed Left: The histogram is shifted towards the left, indicating underexposure with more shadows. This often occurs in low-light situations or when shooting predominantly dark scenes.
- Skewed Right: The histogram is shifted towards the right, indicating overexposure with more highlights. This happens in scenes with lots of bright areas or when shooting with excessive light.
- Bimodal: A bimodal histogram shows two peaks, suggesting that your image has two dominant tonal ranges. This might happen in high-contrast scenes where the image has both very dark and very bright areas.
3. The Role of Exposure Compensation: Exposure compensation is a useful feature that allows you to override the camera’s metered exposure settings. When you review the histogram and notice it’s not where you want it to be, you can use exposure compensation to make adjustments without having to switch to manual mode.
4. Using Histograms in Post-Processing: Histograms are not only helpful in-camera but also during post-processing. Most photo editing software displays histograms to help you make exposure and tonal adjustments effectively. By referring to the histogram, you can avoid clipping highlights or shadows and maintain better control over your image’s tonal range.
5. The Importance of RAW Format: Shooting in RAW format provides more data and dynamic range compared to JPEG. This extra flexibility can be crucial when dealing with challenging lighting situations. With a RAW file, you have more room to adjust exposure in post-processing without sacrificing image quality.
6. Bracketing and Histograms: Bracketing involves taking multiple shots of the same scene at different exposure levels. By reviewing the histograms of these bracketed shots, you can choose the one that best represents your desired tonal range.
7. Histograms for Black-and-White Photography: Histograms are equally valuable in black-and-white photography. In monochrome images, the histogram helps you achieve the desired contrast and tonal separation between different elements in the scene.
8. Avoiding Histogram “Gaps”: A “gap” in a histogram represents a range of tones with no pixel data. This could indicate lost shadow or highlight detail. Be cautious of gaps and try to avoid them by adjusting exposure settings accordingly.
Remember that histograms are not the ultimate authority on image quality, and artistic intent plays a crucial role in photography. Sometimes, intentionally clipping highlights or shadows might be a creative decision to achieve a specific mood or style. As you gain more experience and practice, you’ll develop a better understanding of using histograms as a guide while also trusting your creative instincts.