


Understanding the histogram and its relation to light meters
Understanding histograms and their relation to light meters is crucial for photographers and videographers to effectively capture well-exposed images and videos. Let’s break down each concept and explore their relationship:
Histogram:
A histogram is a graphical representation of the distribution of tones or colors in an image. It displays the number of pixels at each brightness level, ranging from pure black (0) to pure white (255) in an 8-bit image. Histograms provide a visual summary of the tonal range and overall exposure of an image.
In a typical histogram, the horizontal axis represents the tonal values, and the vertical axis represents the number of pixels at each brightness level. The graph will show peaks and valleys, indicating areas of the image that are predominantly dark, bright, or mid-toned.
Relation to Light Meters:
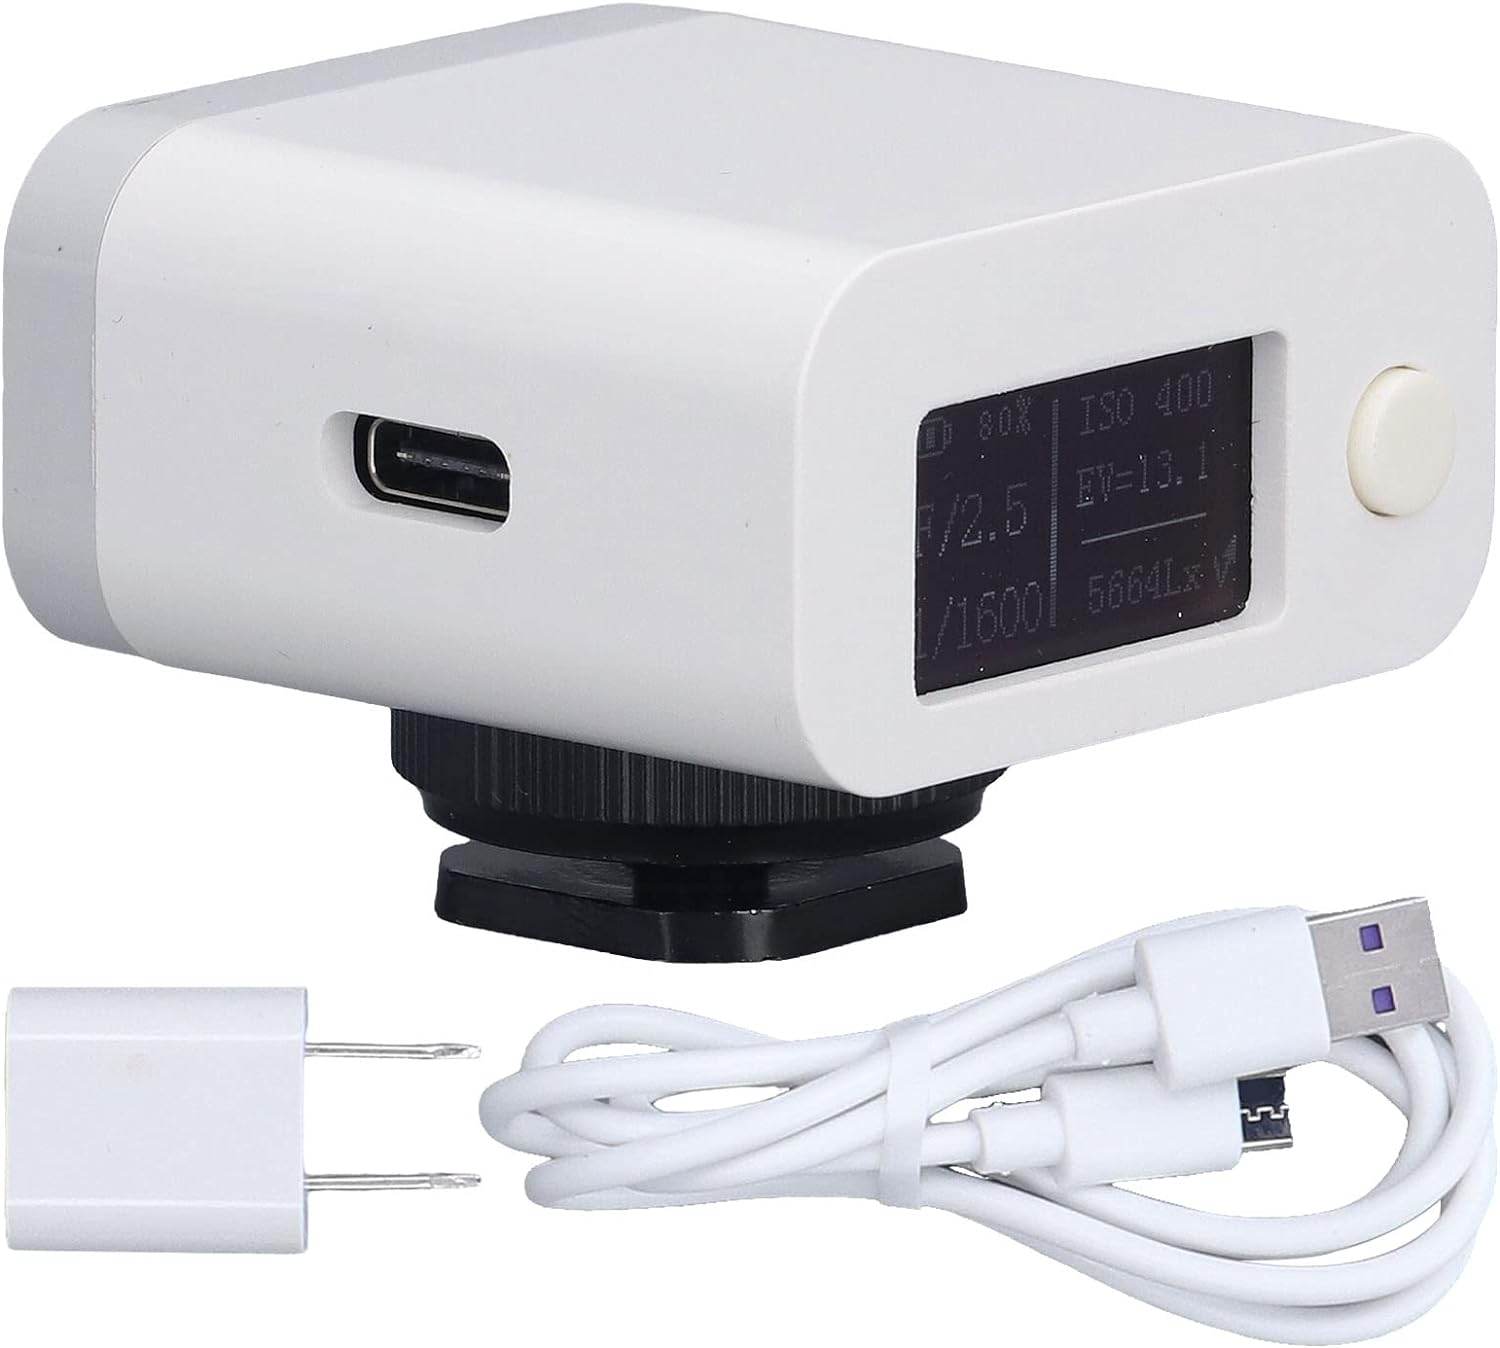
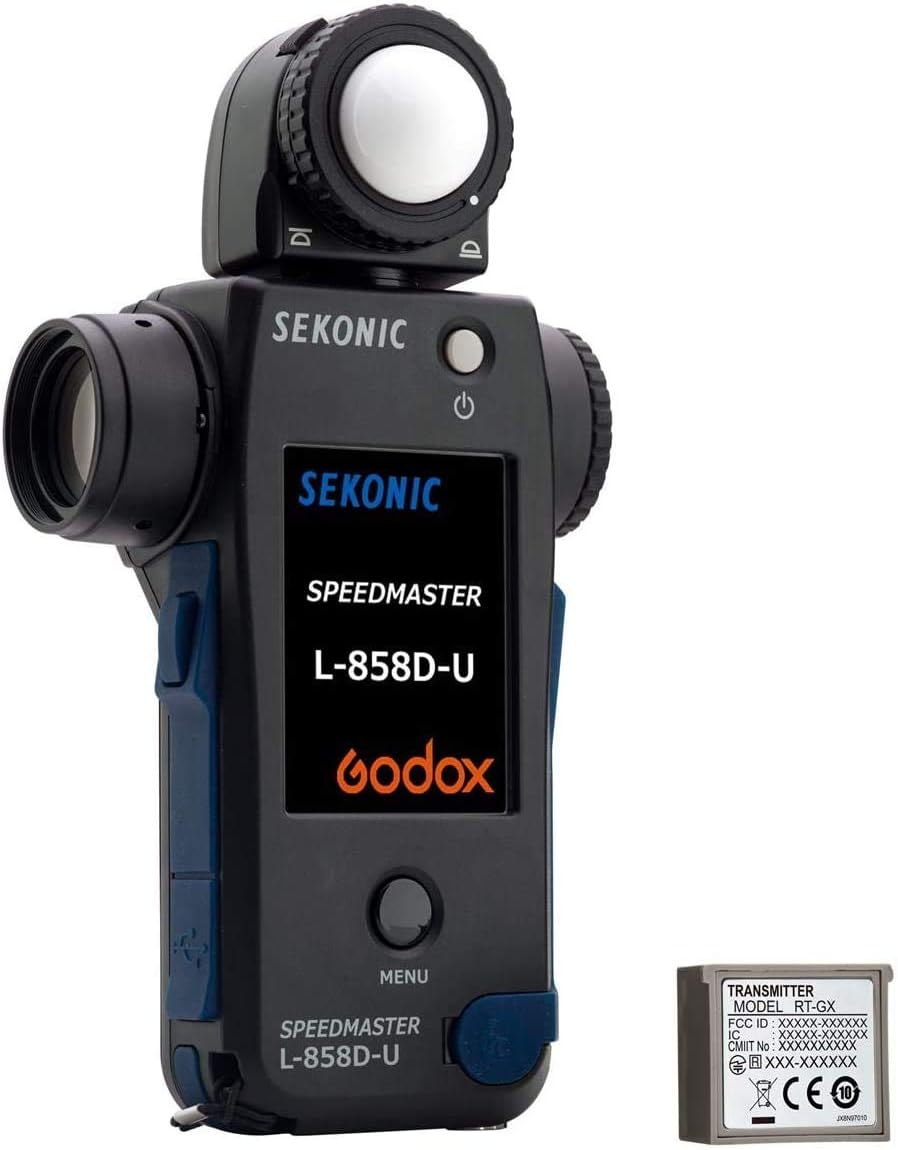
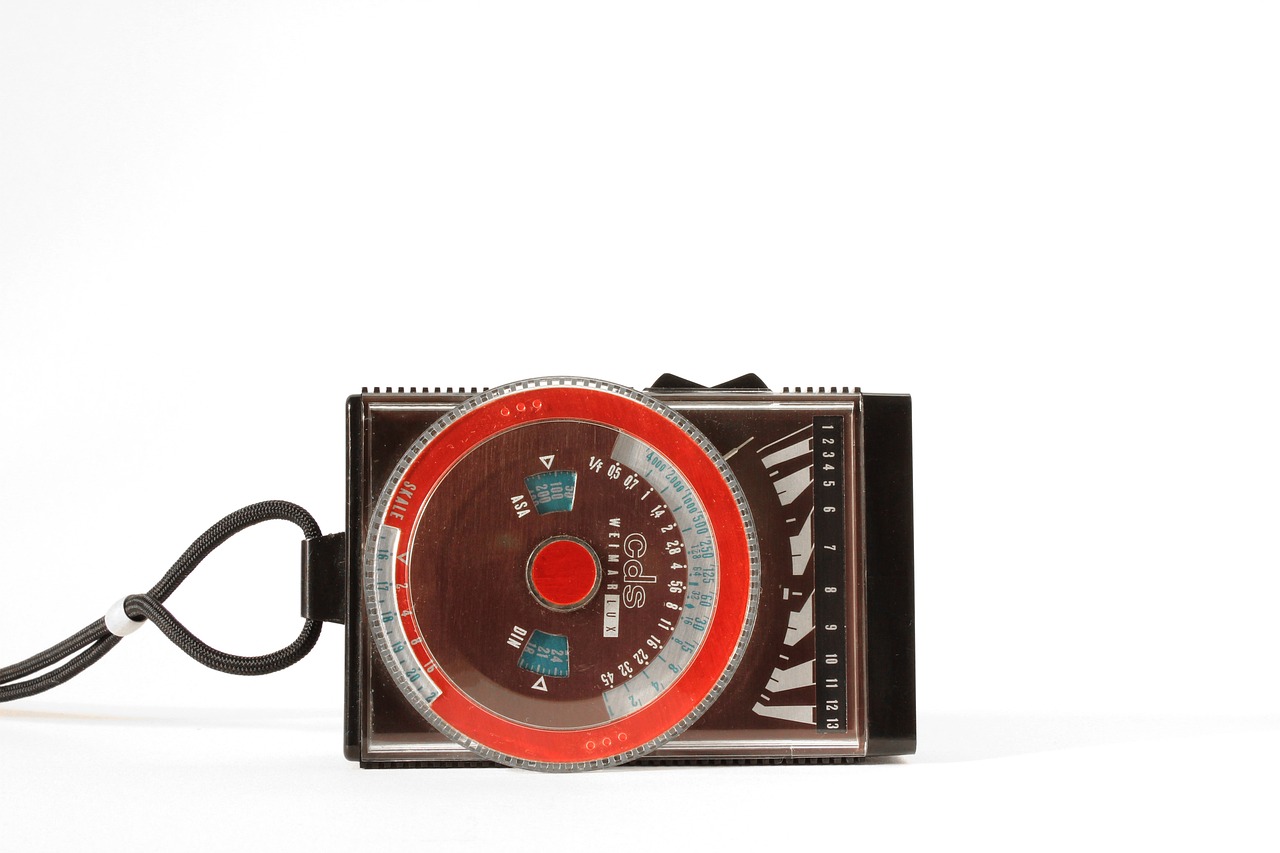
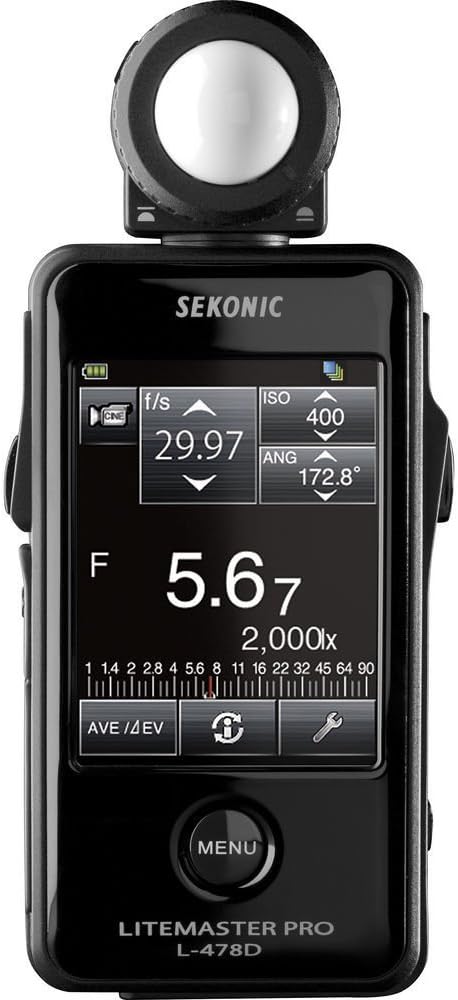
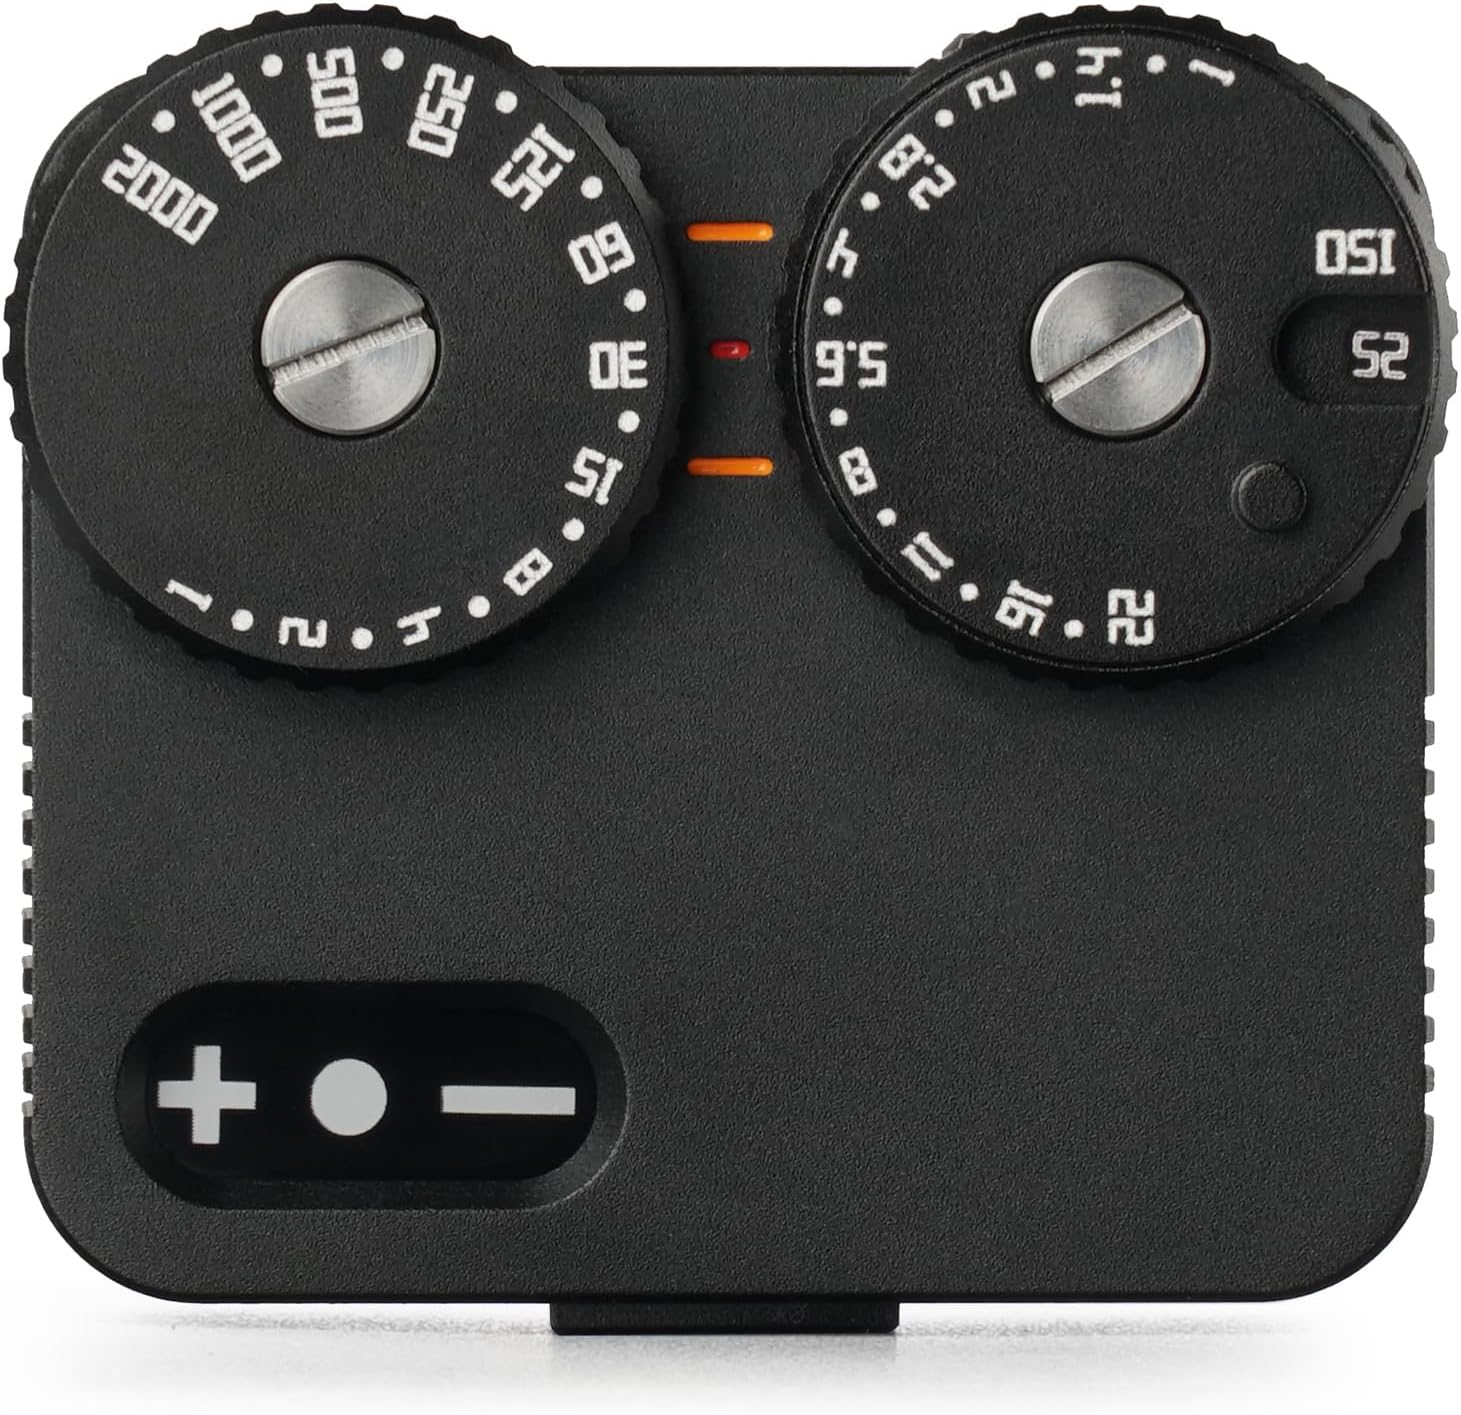
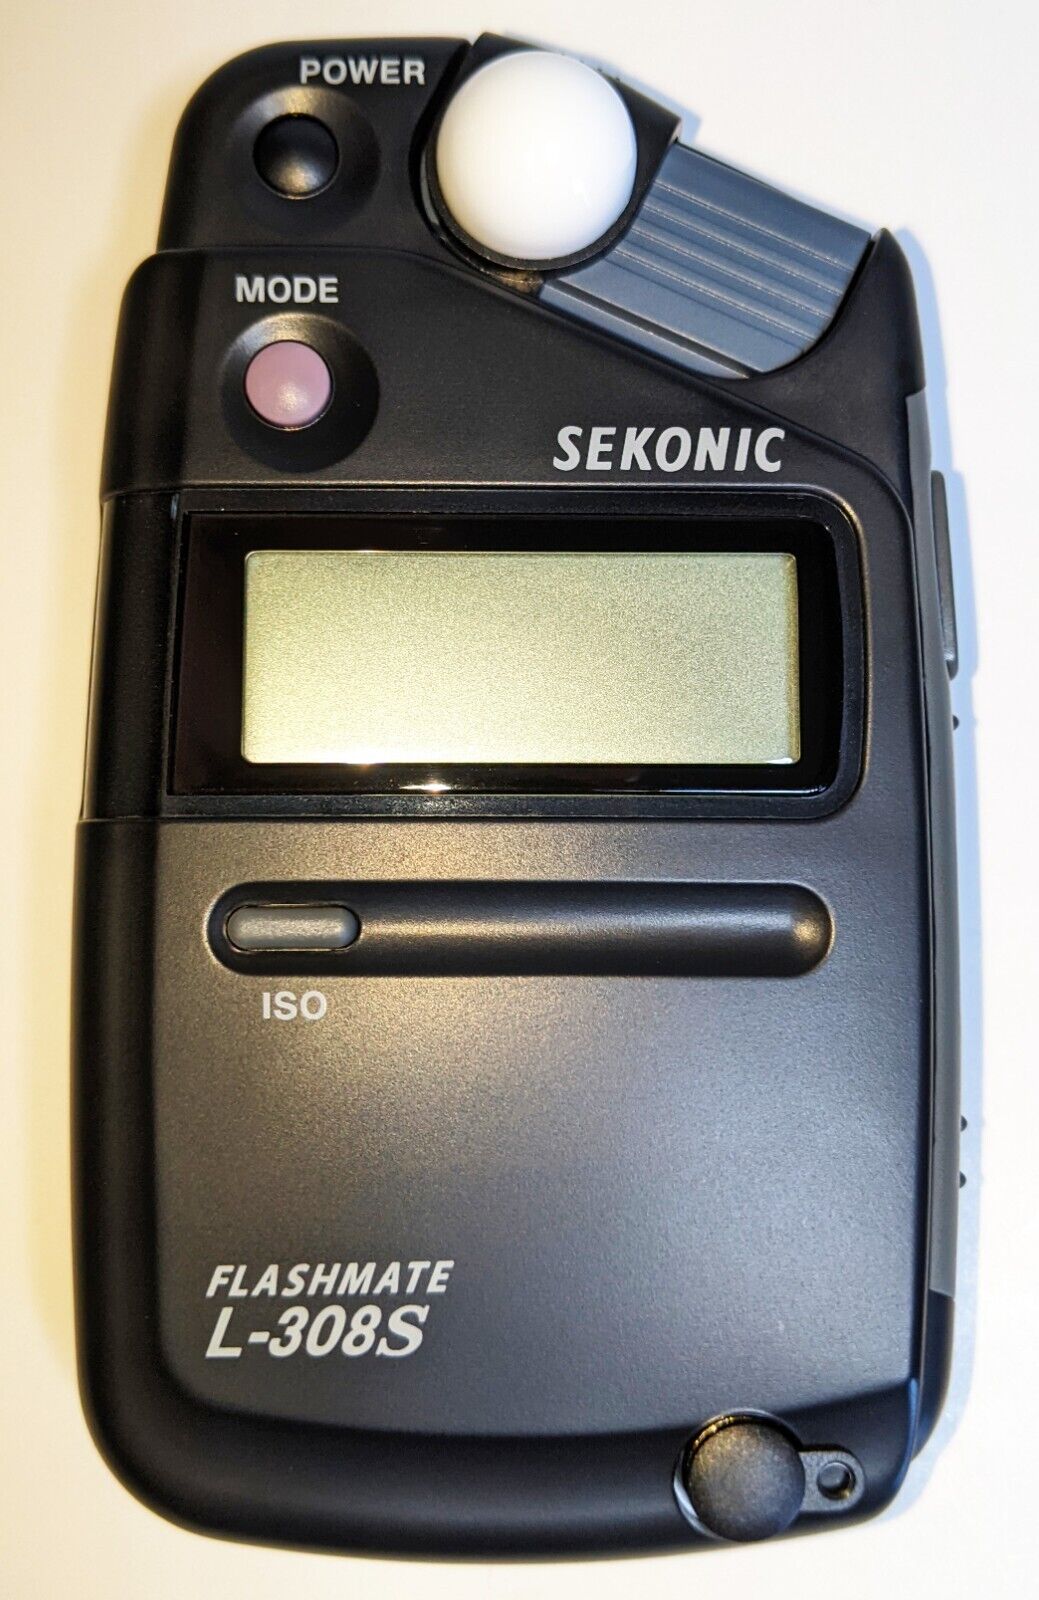
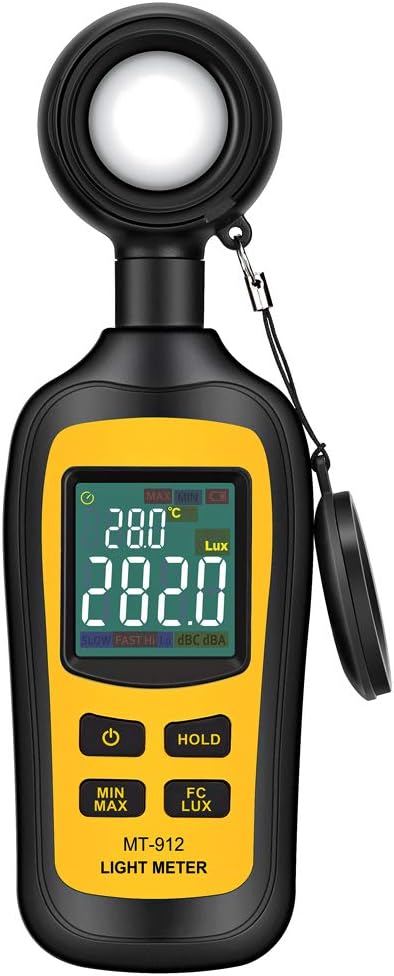
Light meters are devices or built-in features found in cameras that measure the amount of light falling on the subject or scene. They help photographers determine the proper exposure settings (shutter speed, aperture, and ISO) to achieve a well-balanced and correctly exposed image.
The relationship between histograms and light meters is as follows:
Exposure Evaluation: Light meters provide exposure readings based on the available light in the scene. They measure the brightness and suggest settings to achieve a balanced exposure. The metering modes (e.g., spot metering, center-weighted metering, evaluative metering) determine how the camera reads the light across the frame.
Histogram as Feedback: After taking a photo, you can review the histogram of the captured image on the camera’s LCD screen. The histogram gives you a visual representation of how the exposure values are distributed across the image.
Using Histograms for Exposure Correction: By analyzing the histogram, you can quickly identify if the image is underexposed (too dark), overexposed (too bright), or properly exposed. Adjustments to exposure settings can be made based on this feedback to achieve the desired tonal distribution.
Avoiding Clipping: Clipping occurs when image data is lost in either the highlights (overexposure) or shadows (underexposure). The histogram helps identify if there are spikes at the edges of the graph, indicating potential clipping. Photographers can adjust their exposure settings to prevent losing detail in those areas.
Histogram Tips:
A well-balanced histogram doesn’t necessarily mean a perfectly centered or evenly distributed graph. It depends on the scene’s content and desired mood.
For high-contrast scenes, you might see gaps on either end of the histogram, indicating areas with pure white and pure black.
Histograms are essential when shooting in challenging lighting conditions, such as sunsets, backlit scenes, or snowy landscapes.
Types of Histograms:
Luminance Histogram: This is the most common type of histogram found in photography. It represents the distribution of brightness values in the image, from shadows (left side) to highlights (right side).
RGB Histogram: This type of histogram displays the distribution of red, green, and blue color channels separately. It is useful for identifying color imbalances and can help fine-tune color adjustments.
Brightness Histogram vs. RGB Histogram: Depending on your camera model or post-processing software, you might have the option to view either a brightness histogram or an RGB histogram. The brightness histogram provides an overall view of the image’s exposure, while the RGB histogram provides insights into color-specific exposures.
Histogram Shapes:
Histograms can have various shapes, which offer insights into different lighting conditions and tonal distributions in the image:
Bell-shaped Histogram: This is an ideal histogram, indicating a well-exposed image with a balanced distribution of shadows, mid-tones, and highlights.
Left-skewed Histogram: The graph is shifted towards the left side, suggesting the image is underexposed, with more shadows and dark areas. This can happen when shooting in low light or with incorrect exposure settings.
Right-skewed Histogram: The graph is shifted towards the right side, indicating the image is overexposed, with more highlights and bright areas. Overexposure can occur when the scene is too bright or exposure settings are too high.
Bimodal Histogram: This type of histogram has two distinct peaks, indicating a scene with significant contrast or multiple dominant tones. It could be a result of capturing a high-contrast scene or scenes with strong color separation.
Using Histograms in Post-processing:
Histograms are not only helpful in the field but also during post-processing:
Exposure Adjustment: While editing photos, you can use the histogram to adjust exposure levels by fine-tuning brightness, contrast, and levels to achieve the desired tonal distribution.
Highlight and Shadow Recovery: In post-processing, you can use the histogram to identify overexposed or underexposed areas and recover details using techniques like dodging and burning.
White Balance: By analyzing the RGB histogram, you can correct color imbalances and achieve accurate white balance in your images.
Histograms in Video:
Histograms are equally valuable in videography, helping filmmakers maintain consistent exposure throughout a scene. Many video cameras and editing software provide histogram tools to monitor exposure levels during video recording and post-production.
Understanding Histogram Zones:
When examining histograms, photographers often refer to different zones that represent specific tonal ranges:
Zone 0: Pure Black
Zone I: Shadows
Zone II: Dark areas with detail
Zone III: Mid-tones
Zone IV: Light areas with detail
Zone V: Middle Grey (18% Grey)
Zone VI: Light areas without detail
Zone VII: Highlights
Zone VIII-IX: Near-white to pure white
Photographers use these zones to evaluate the exposure and ensure critical areas retain enough detail without clipping.
In conclusion, histograms are powerful tools that provide valuable feedback on exposure and tonal distribution in images and videos. By understanding histograms and their relation to light meters, photographers and videographers can make informed decisions to create visually appealing and well-exposed content.