


Understanding Lens Test Charts

When it comes to evaluating the quality and performance of camera lenses, professional photographers, videographers, and optical engineers rely on an indispensable tool known as the “Lens Test Chart.” These charts are specially designed targets that enable users to assess various optical characteristics, such as sharpness, distortion, chromatic aberration, and resolution. In this article, we will delve into the significance of lens test charts, their types, and their role in ensuring top-notch image quality.
Understanding Lens Test Charts
Lens test charts are standardized tools used to examine the optical performance of camera lenses in a controlled environment. These charts consist of intricate patterns and precise elements that challenge the lens’s capabilities and help gauge its overall quality. When a lens is subjected to these charts, it is easier to identify any shortcomings, detect irregularities, and compare performance between different lenses.
Types of Lens Test Charts
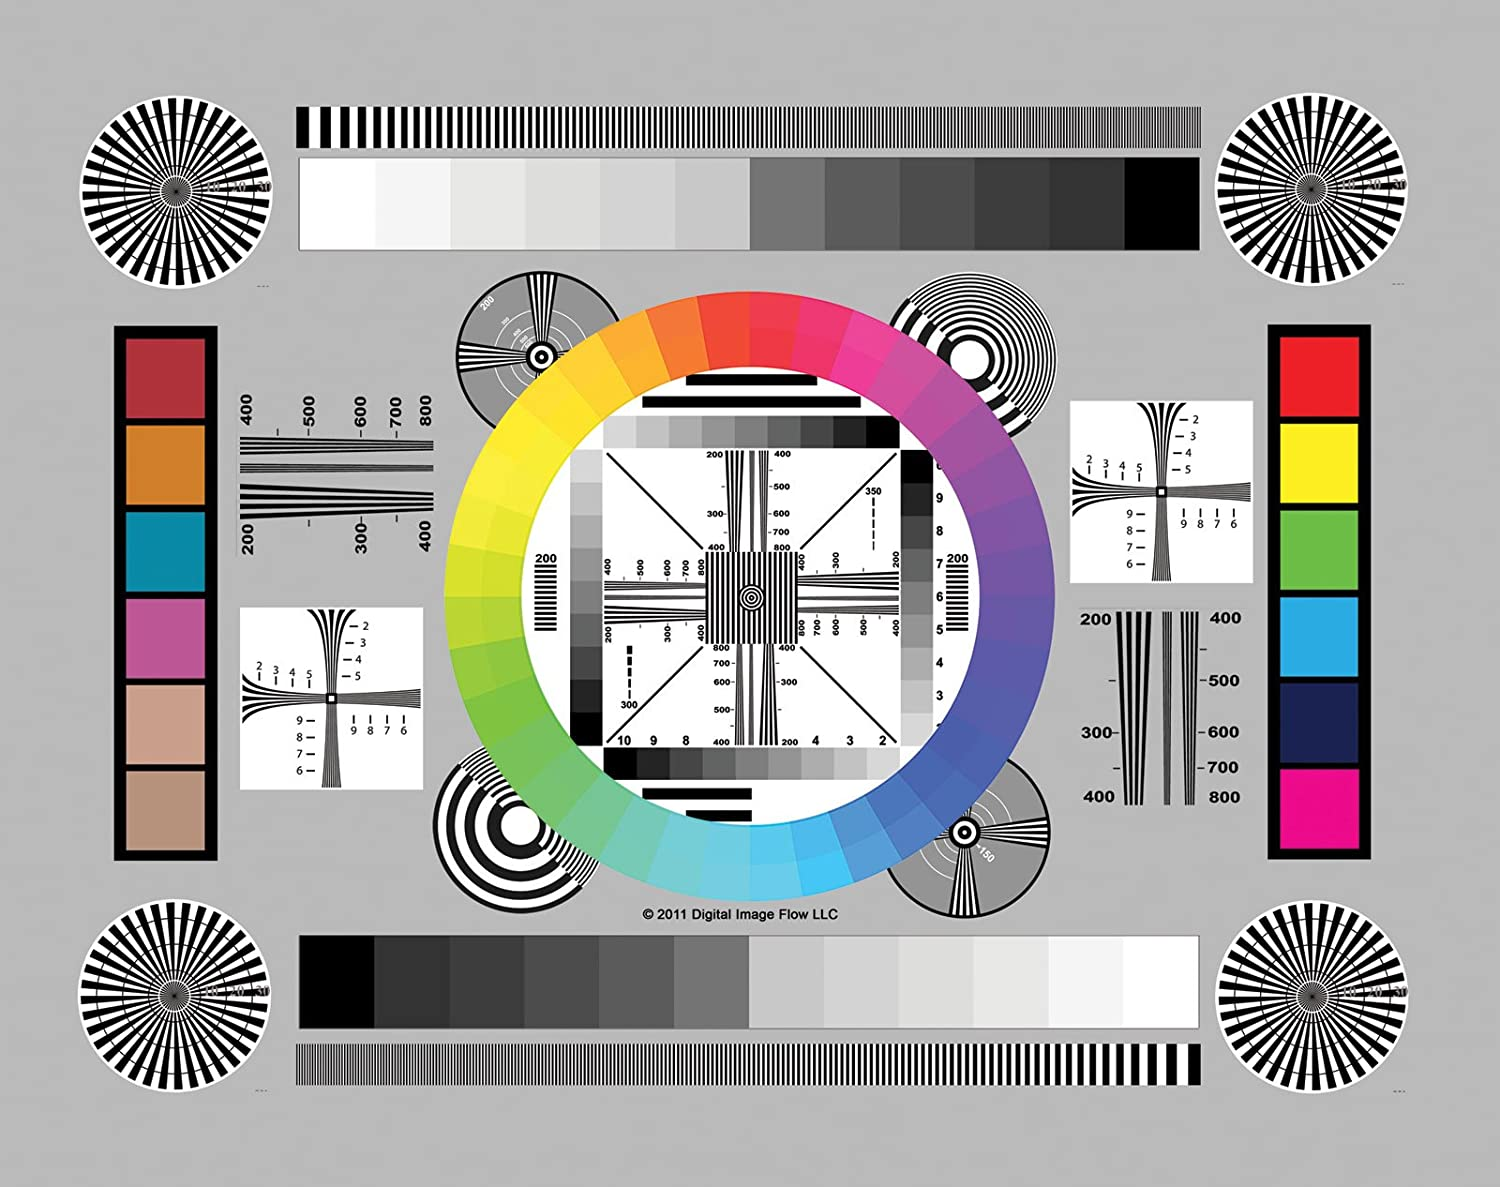
ISO 12233 Chart: The ISO 12233 chart is one of the most widely used and accepted lens test charts. It features a well-defined slanted-edge pattern that helps assess a lens’s sharpness and resolution capabilities. By capturing images of this chart at varying focal lengths and apertures, photographers can determine the lens’s optimal settings for achieving the sharpest results.
Siemens Star Chart: The Siemens Star chart comprises a series of concentric circles, forming a star-like pattern. This chart is useful in measuring both resolution and distortion. When the lens captures this pattern, any distortions present in the image become apparent.
ColorChecker Chart: Unlike other charts that focus primarily on sharpness and distortion, the ColorChecker chart is designed to evaluate color accuracy and color rendition. It features a grid of color patches with known and consistent color values, enabling photographers to check how accurately the lens reproduces colors.
Checkerboard Chart: The checkerboard chart consists of black and white squares arranged in a checkerboard pattern. This chart helps identify potential issues like chromatic aberration (color fringing) and vignetting (light falloff towards the corners).
SFRplus Chart: The SFRplus chart is a modern lens test chart that incorporates various patterns, including slanted edges, circles, squares, and stars. It provides a comprehensive evaluation of lens performance, including resolution, distortion, astigmatism, and chromatic aberration.
Importance of Lens Test Charts
Quality Assurance: For manufacturers, lens test charts are essential tools for quality assurance during the production process. By testing lenses against standardized charts, manufacturers can ensure that each lens meets specific optical performance criteria before reaching the market.
Lens Selection: Lens test charts assist photographers and videographers in selecting the most suitable lenses for their needs. By comparing lenses side by side using standardized tests, professionals can make informed decisions based on the desired image quality.
Performance Optimization: Lens test charts allow photographers to fine-tune their equipment settings, such as aperture and focal length, to achieve the best possible results in terms of sharpness, color fidelity, and distortion correction.
Lens Calibration and Alignment:
Lens test charts are crucial for lens calibration and alignment, especially in the field of optical engineering and lens manufacturing. During the production process, lenses may have slight variations in their optical characteristics. By testing each lens against a lens test chart, manufacturers can identify and correct any discrepancies, ensuring consistency and accuracy across all lenses produced.
Lens Comparison and Evaluation:
Professional photographers and videographers often need to compare different lenses to determine which one suits their specific needs. Lens test charts provide a standardized method for side-by-side comparisons. Photographers can test multiple lenses using the same chart, enabling them to assess image quality, sharpness, distortion, and other optical properties, making an informed choice for their photographic requirements.
Lens Quality Control:
Lens test charts are an essential part of the quality control process for both camera manufacturers and lens rental services. Before a camera or lens is released to the market or rented out to customers, it undergoes rigorous testing against lens test charts to ensure that it meets the specified optical performance criteria. This practice ensures that customers receive equipment that performs optimally and reliably.
Lens Correction Profiles:
Lens test charts are instrumental in creating lens correction profiles for software applications. When photographers shoot images with a specific lens, they may encounter optical issues like barrel distortion, pincushion distortion, and chromatic aberration. By capturing images of lens test charts and analyzing the distortions, software developers can create correction profiles to minimize these optical imperfections during post-processing, resulting in improved image quality.
Research and Development:
In the field of optical engineering, researchers and developers use lens test charts to study and analyze the performance of new lens designs and experimental optical systems. These charts help researchers understand how different optical elements and configurations affect image quality, enabling them to fine-tune and optimize their designs.
Lens Service and Repair:
Lens test charts are invaluable tools for lens service and repair centers. When customers bring in their lenses for maintenance or repair, technicians can use lens test charts to assess the lens’s performance and identify any issues that need fixing. This ensures that the lens is restored to its optimal condition before being returned to the owner.
Lens Testing for Astrophotography and Specialized Applications:
In specialized fields like astrophotography, where pinpoint sharpness and accurate colors are crucial, lens test charts become even more critical. Astrophotographers often use lens test charts to evaluate the performance of their lenses for capturing stars, galaxies, and other celestial objects.